
Reflections on Tableau
My history and internal thoughts about this BI tool

My History with Tableau
For the past few years, Tableau has been an integral part of my career and the main BI tool I used in my pursuit of data visualization and analysis skills. I credit it for a lot, especially as a major factor of success for the first time I tried job searching as an actual professional rather than as a kid out of college. I suppose it’s strange to credit a tool for such a thing when the ongoing point being made about tech careers is that the tools don’t matter, it’s the skills and fundamentals that do. That is a true point but in my experience, you also have to use tools to build those skills and fundamentals in the first place. No one cartwheels out the womb knowing how to do advanced analytics nor is it a simple matter to go from theory to practice. You have to cut your teeth by just doing analytics with a consistent tool at some point.
So how did I come across Tableau? Well, my first job out of college when I finished my masters was at one of the Big 3 auto companies. I was there for a few years but felt like I hadn’t learned enough, which is pretty typical when working at large companies. The resources you have at enterprise level companies are large and the benefits are nice but it’s not the place you want to be if you want to explore up-to-date skills. And as a 20-something-year-old, I felt that that it was time to move on to something else. That job search turned out to be super hard though. After your first job, you are no longer the cheap junior fresh out of school anymore. Even in an economic environment that was supposedly better than the current mess, it took me more than year to secure a new job. Yes, I could have interviewed better or networked more looking back. But the most common feedback (when I did get it) was that my background didn’t match the position. Fair enough - going from a large enterprise to an SMB that I was aiming for is actually a big jump that hiring managers tend to reject when looking for a “match”. My background might have made me a better match at another enterprise like IBM or Dell but it wasn’t what I was aiming for.
I did a couple things to finally secure that next job. I knew my skills and technologies were outdated so I did a 6 month part time analytics bootcamp to learn new technologies fast. I got in touch with a former roommate whose wife was able to refer me (a stroke of luck I had no control over). I opened up Tableau and got involved in Makeover Monday1 and submitted my work on Twitter to practice my skills. Why Tableau? Simply put: I use a Mac as my personal laptop so I needed a BI tool that could work on it. Power BI was out of the question since the desktop version is Windows only (even though it was what my enterprise company at the time used).
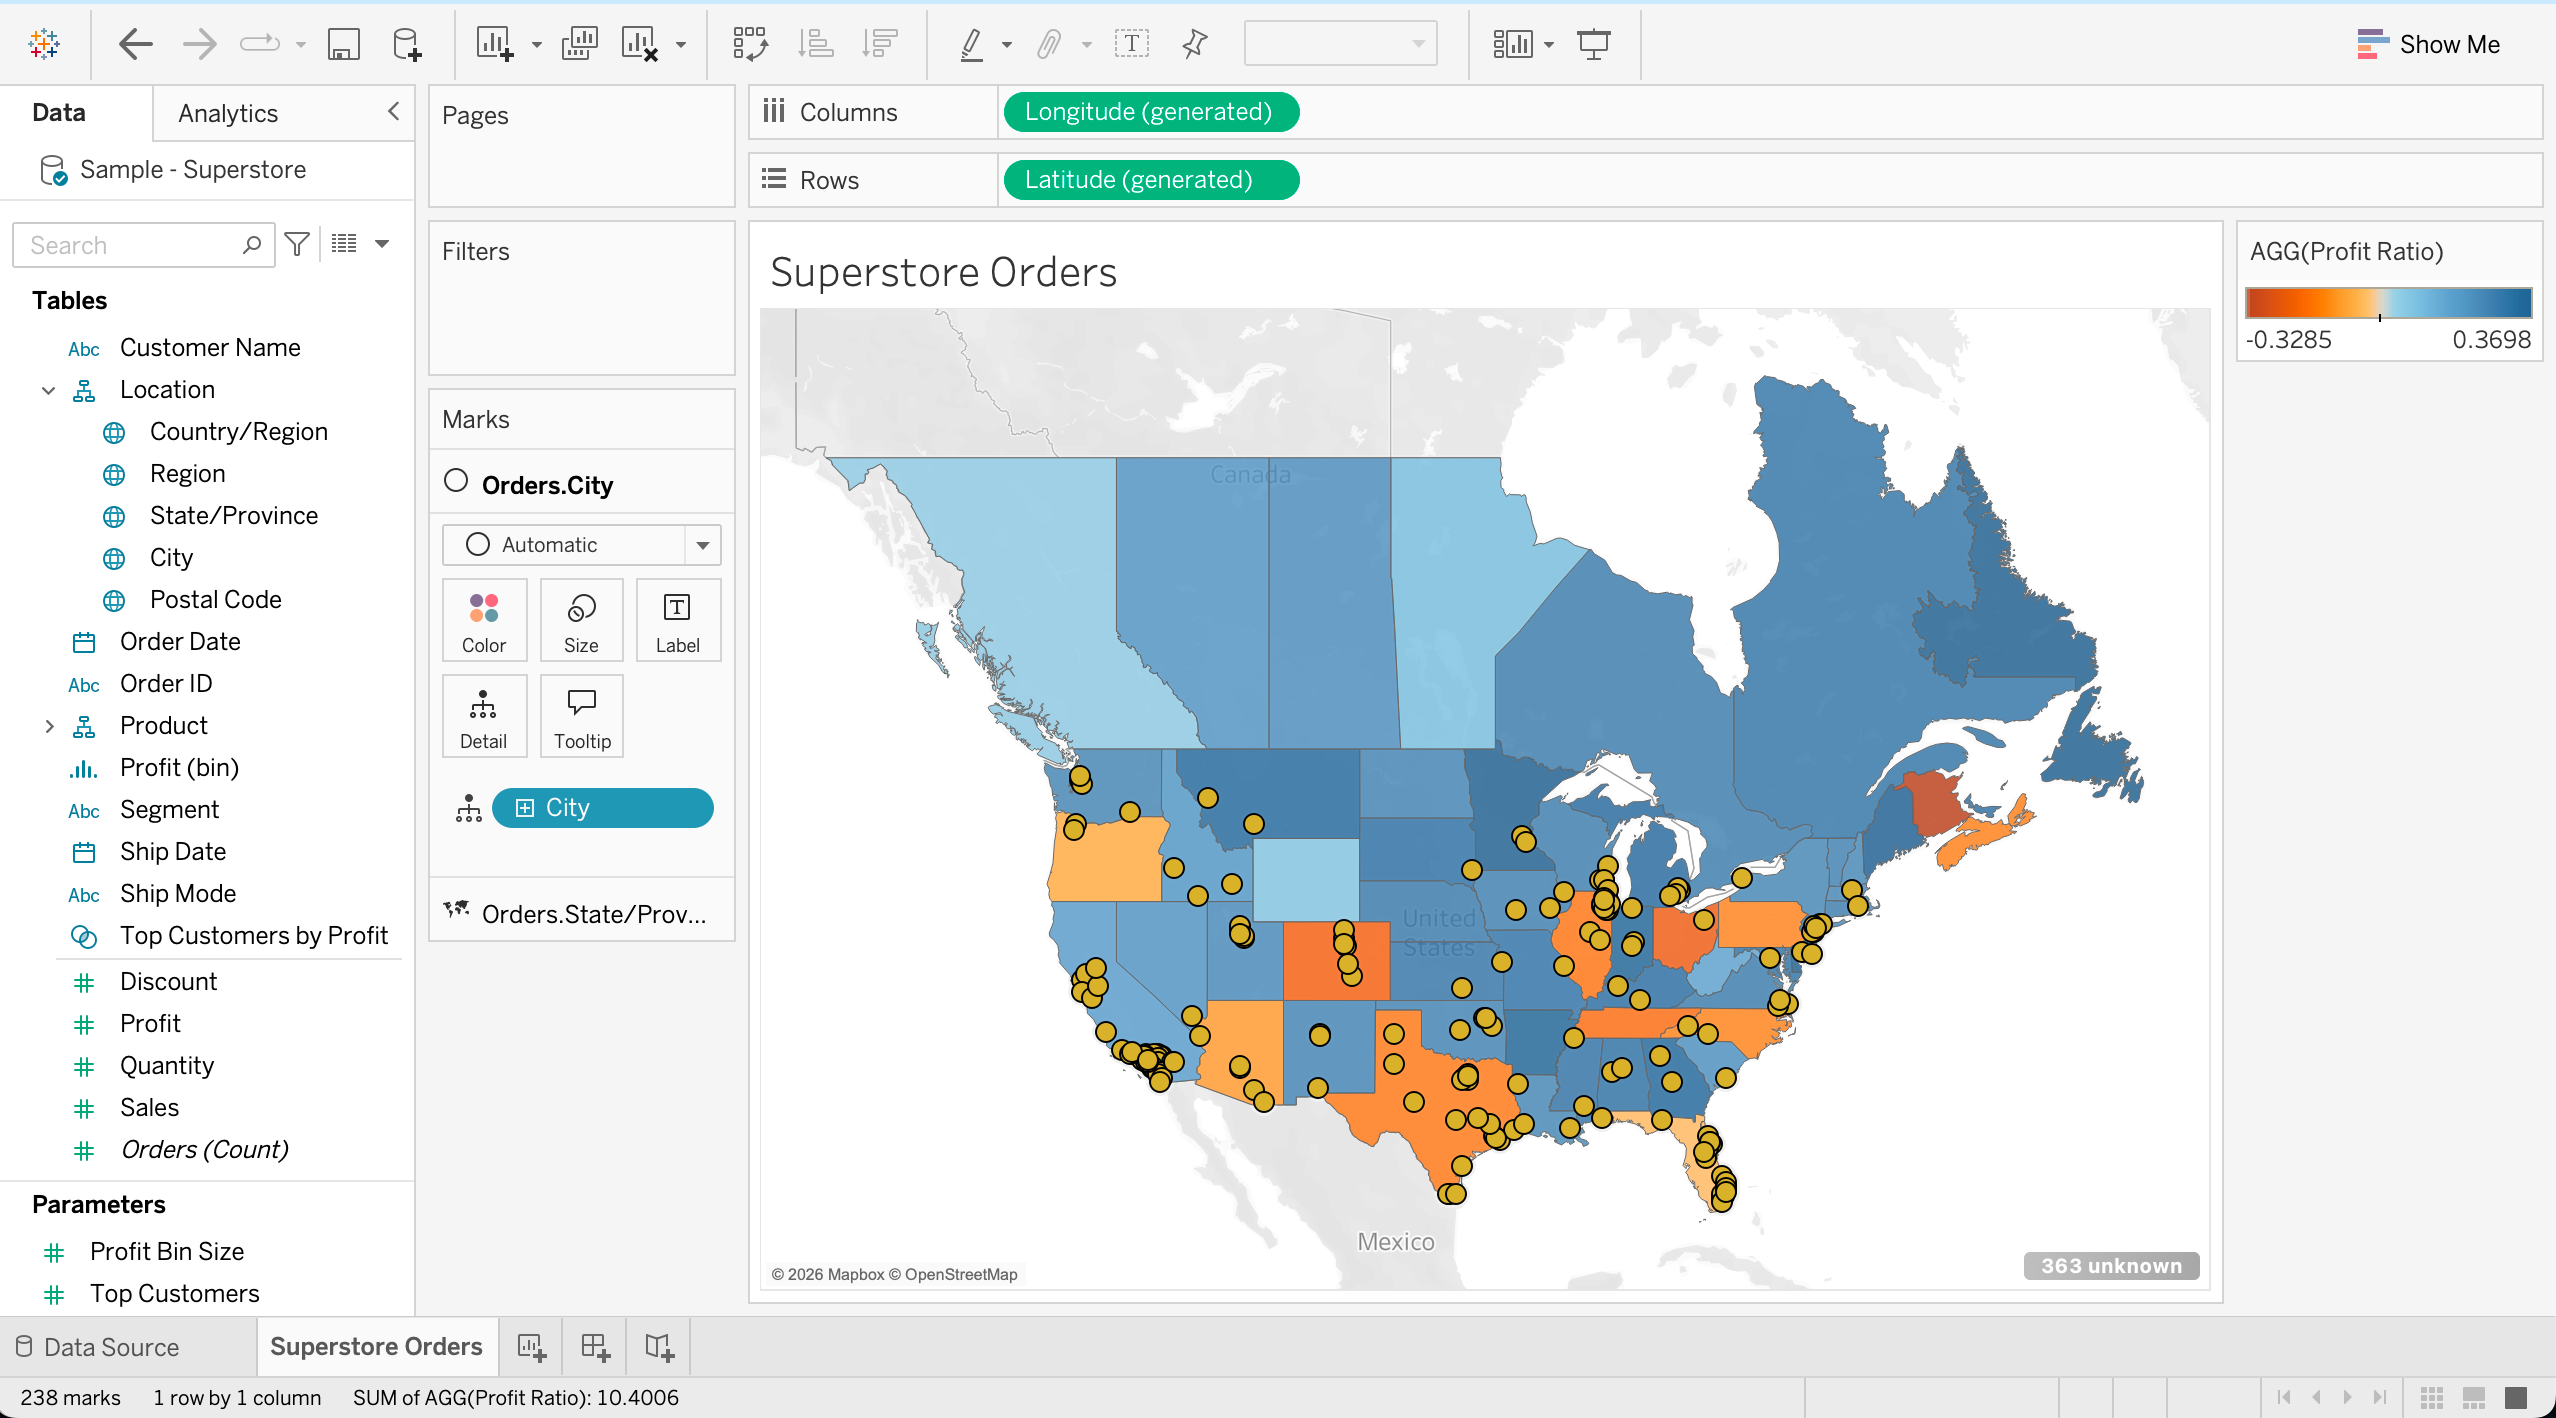
I cannot even begin to describe the fun I started having with analyzing data in Tableau on my own time. It was such a flexible tool and was so refreshing compared to the restrictions I felt in my day-to-day corporate job. In fact, when I was interviewing for a BI analyst role using Tableau at Keller Williams (my next place of employment), the hiring manager, Kit, said he almost overlooked my application based on my background. But there was something that caught his eye: one of the dashboards on my Tableau Public that I did for Makeover Monday that he found really funny. To be fair, I was still learning the tool and even though I knew how to make a dashboard, I didn’t know how to make a good one. Here it is in all its glory (link here):
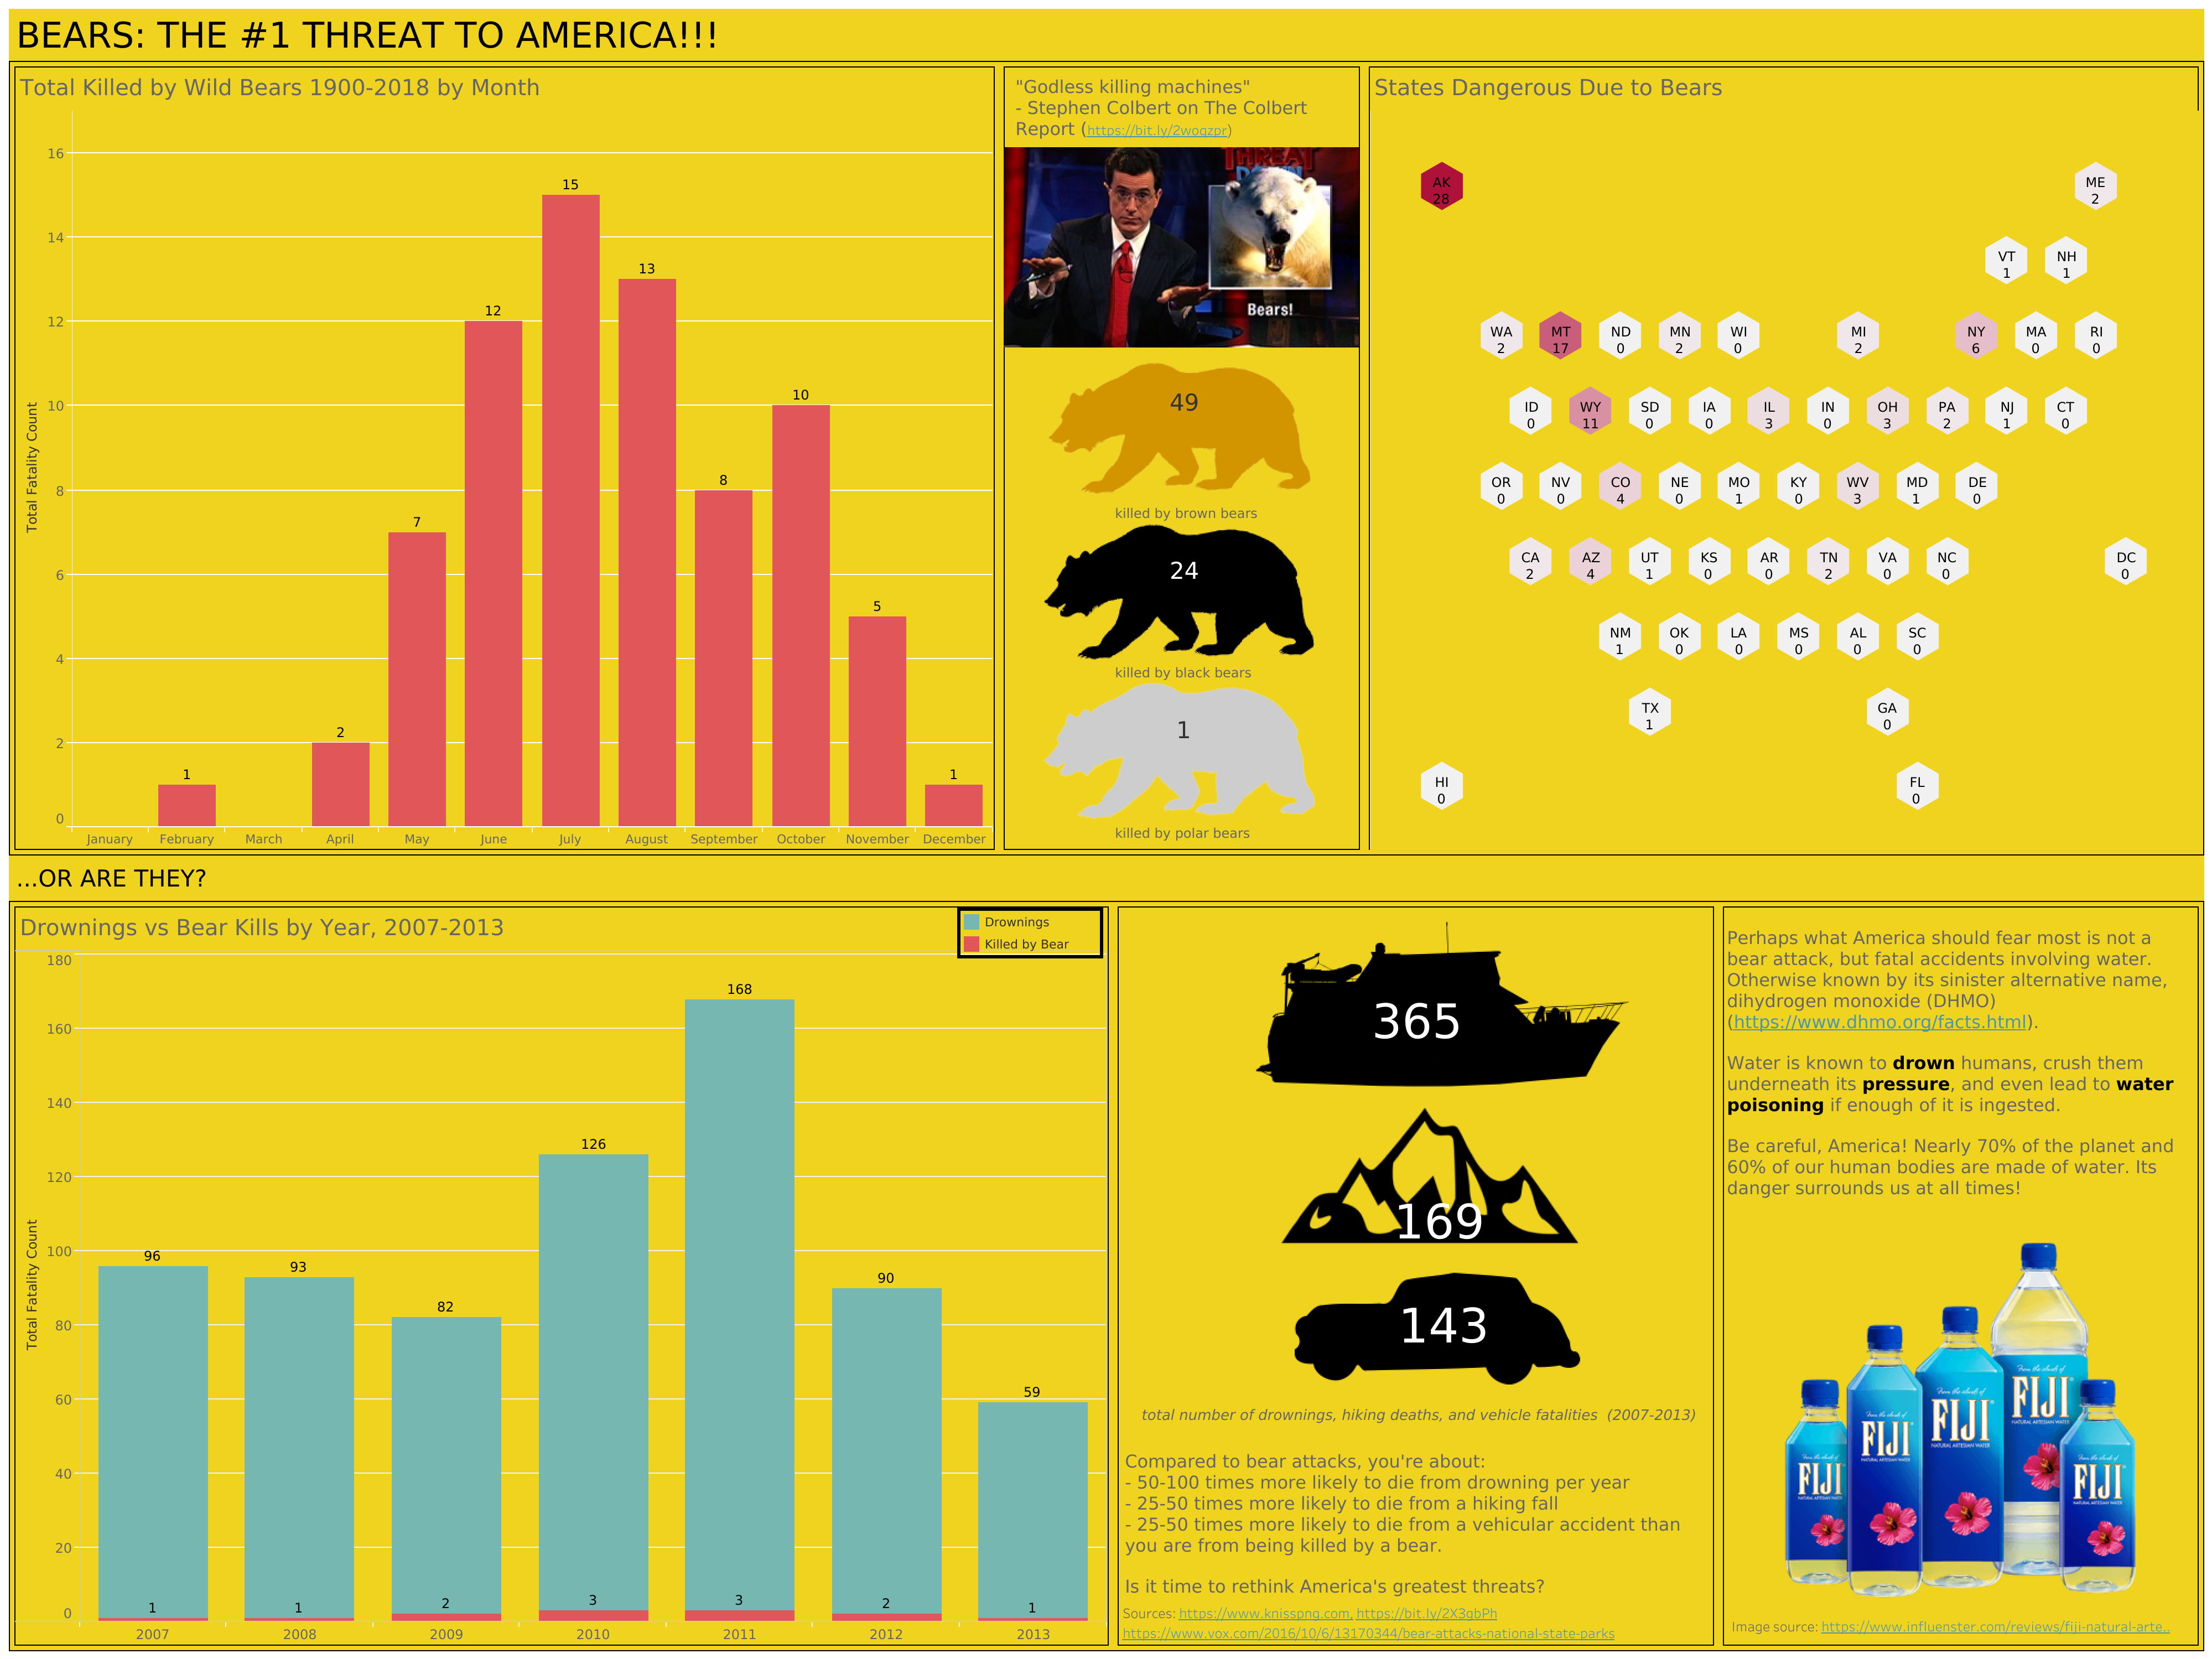
Man, this is a terrible dashboard when I look back at it. But this thing did its job and captured the attention I needed, didn’t it? This is what working in public looks like.
Tableau Community
Speaking of Makeover Monday, the community built around Tableau (or the “DataFam”) is what really kept me going. I don’t think I’ve ever seen such a positive community in this space that matches their enthusiasm for the product and what it allowed them to do. There are countless names I could list off the top of my head who have been heavily involved with this tool from Andy Kriebel to Eva Murray to The Flerlage Twins to Priya Padham to Lisa Trescott and far more I am unfortunately omitting out of the interest of space.
There are yearly conferences dedicated to Tableau (which also hosts the IronViz competition), a Visionary program which acts as a Hall of Fame for top users, Tableau User Groups to explore data and grow together grouped around location or topic, groups like Viz for Social Good that were dedicated to specific causes, The Information Lab which trained so many career switchers, and so many more ways to get involved and learn how to work with data.
Tableau was also a great way for me to learn the art of data storytelling2. It was by being interested in this that I learned how to more effectively communicate with data. Just throwing random numbers or spaghetti charts that try to do 100 things at once is a surefire way to confuse users and cause them to trust the numbers less instead of more. By learning how to make good charts to communicate the point effectively, you can really clear up confusion on what data means and what it is telling you. Tableau was flexible enough to experiment with this skill.
That flexibility is the key to Tableau’s identity. You can see its unique selling proposition: be flexible enough so that you can answer any analytics question in a visual manner. People change their questions creatively all the time so the tool should be able to accommodate that. It’s how you get something like this map visualization of Beer Hiking in Berlin from Judit Bekker on Tableau Public.

Tableau Public is the free version of Tableau and other than database connectors, its main functionality is pretty much the same as Tableau Desktop. This made it very popular to scale for newbie users like I once was or to use it in data bootcamps or college courses. I myself have given feedback to multiple students who were trying to learn data analytics using Tableau Public and I think it was a pivotal factor in how Tableau skills came to be so common and asked for in the analytics space.
Tableau in the workplace
You can see by now that I was introduced to Tableau in a very specific way: by going through its Tableau Public community and getting involved. That is very different path than encountering it only in the workplace because businesses can operate at a different level than the Public community does. While creativity is at the forefront of Public visualizations, it’s really more clear communication and simple designs that are emphasized in the workspace (for good reason of course). It takes skill to produce simple designs though (and you realize it after creating something too complicated).
Am I saying that creative custom dashboards are pointless to do and totally the wrong thing to spend time on? No, of course not. Doing creative projects like Makeover Monday really helps you stretch your mind and learn the tool so that you can reach into that toolbox when it’s time to create something at work. Sure, you might never deliver that totally custom infographic about bears that you created in Tableau Public, but you can certainly use the skills you developed making it to inform you on how to make what the marketing department is asking for or how to do custom displays that emphasize what they really need to focus on for the next quarter.
I do find a lot of warring going on amongst BI tools in the workplace. I know that it’s silly to be Team Tableau/Team Power BI/Team Looker but people can’t help themselves3. And to be honest, there is logic to their preferences. The skills between BI tools are not totally transferrable. Sure, a bar chart is a bar chart but how you interact with BI tools and how well you know its quirks and pros/cons is a skill that people are reluctant to give up on. If I got really good at Tableau, then I’m not gonna be fast at using say Domo so I would feel less skilled and vice versa. Analysts tend to really like and want to stick with their first BI tool or first tool that they got good with because switching implies a cost and they lose their expertise the moment they do that4. It doesn’t feel great to lose something you worked so hard to attain so there’s a real human element over these BI tool preferences.
Tableau’s Challenges
Now, Tableau is a great tool for creating advanced, custom visualizations (and its mapping capabilities are by far the best in this space without needing code). But it is by no means a perfect tool or the right tool for plenty of teams and places out there. I’ll describe some of the very real difficulties I’ve experienced with Tableau (which are going to be very specific just due to having actual experience. Pretty similar to how you can complain about your home country way better than other countries). If these are the only things you get to experience with Tableau in the workplace, I can totally see why you would not be so keen on it.
Custom visuals can be hard to maintain. Do you know what “tableau” means in French? It could mean “table” but it also means “picture or canvas” and I think that fits the real meaning of Tableau better. Tableau is a canvas and you feel that when you open up a blank new workbook each time. It’s meant for custom work and visualizations. Custom things can be hard and expensive to maintain. Sure, a skilled analyst can spin up what they need pretty quickly but they had to build the skill for that. Other users don’t have the time to master Tableau on top of their actual main work so they find it hard to pick up. Tableau is easy to pick up for people actually interested in data but hard for those that just want an answer. And I would argue that because Tableau is so flexible, this makes it relatively unopinionated as a tool and default guardrails are not there to guide new or occasional users all that much5. It is fair to question if your business needs custom visuals or they just need the same template again and again6.
Tableau is not an online spreadsheet. I used to get really annoyed at this (ok, I still do) but to be honest, lots of users think of data as just a bunch of spreadsheets. But that’s not how Tableau works. Tableau is optimized to aggregate large amounts of data. Creating a big, giant detailed line-by-line table of records is the absolute worst and slowest way to use Tableau but lots of people try to do it because that’s their frame of reference or they try to use it for reporting rather than analysis (which is not the same). Finance departments tend to get annoyed at this a lot but honestly, Tableau (and other BI tools made at the time) was not made for line-by-line financial reporting. You’re using the wrong tool for the job if you need it for this.

Not BI-as-code. This point bothers engineers the most. Because Tableau was made as a drag-and-drop UI tool, it’s not a code-first tool. It was made to appeal to business users and analysts who didn’t really know how to code (a rarer commodity in the age before LLMs but made a lot of sense for that audience for a long time). Changes that happen in Tableau are not tracked to the degree they would be in a Git-style workflow7. Sure, there’s dashboard versioning but it’s rudimentary in comparison to Git. The Tableau API can be a bit difficult to work with due to its age and accumulation of products over the years (but I will probably say the same thing about any tool after a decade or two of existence). Fitting Tableau within the current age of LLM tools is a little awkward. Yes, there are MCP servers and AI agents being built in but Tableau matured as a product that isn’t code-first and it’s really hard to go back and change the core product at this point (hence the push for Tableau Next). And yes, Tableau files are just XML underneath the hood and you can certainly hack it with Claude but it’s not native is what I am saying.
Governance is weak. This points to the difficulty of dealing with tracking calculation formulas within Tableau workbooks and the pain of migrations. Formulas are very easy to define on the fly with Tableau without any need for code. They are very hard to track and different versions of calculations can be locked in one workbook without being able to easily share them in another so multiple versions of the truth occur. You can define them in a published dataset but editing those are hard without the correct permission structure and licenses in place. Struggles usually occur over this. Flexibility comes at a cost. And custom SQL is a nightmare at scale.
Misuse of Tableau. Ok well, this one applies to all tools in general. If you use a tool the wrong way, you will get frustrated with it (and because BI tools are so visual, they get a huge amount of the blame even if the real problem lies closer to the source data. You blame what you can see after all). But also, because Tableau is so flexible you are allowed to make things that you really shouldn’t. I have seen users create a huge dashboard app out of Tableau with 100+ filters, 50+ parameters, every chart know to man, and more. And what happens when it breaks down? They turn it over to the data team to fix it up for them. I assure you, it does not make us happy. I would also argue that only making dashboards is a misuse of Tableau8 because it is really more of a visual analytics tool with dashboard capabilities. But oftentimes, dashboards are the only thing users know what to ask for because they’ve seen one so many times. That’s a deeper rooted problem than just the BI tool though (which may be changing in the current times).
External reporting is not a use case. This one is another misuse but needs special callout. Tableau is very much a visual analytics tool for internal users. It was never built for external reporting and its license structure reflects that. You need a license to access any dashboard or view in it and your IT team probably doesn’t want to give one to an external company. If you want to use Tableau as an email system to send compliance reports to business partners, then you are not using the correct tool.
Support gets weaker under Salesforce. This one is a consequence of the Salesforce acquisition. There have always been a number of long-standing bugs with Tableau (it’s a tool with a long legacy of course). They are unlikely to be focused on while Salesforce is incentivized to build Tableau Next. Their support center got moved under Salesforce and it’s apparent that Salesforce support does not know Tableau when I tried to use them. Granted…I also understand why it has to be this way. Tableau has a lot of legacy and rebuilding a legacy application is an enormous task, especially while you still have millions of users on it (I’m still having trouble moving just one data warehouse). Redoing an application that has existed for 20+ years? It would be easier to start from scratch and I think that is what Salesforce is doing. But this version of Tableau is not going to be built for long-time users but rather for other types of users. It remains to be seen how appealing this will be in the long run.
Tableau Going Forward
What do I think is in store for Tableau’s future? Here’s my take: I think it will become more of a narrow player in the BI tool space as its use case is more narrow than previously thought (and Salesforce will prioritize itself). Flexibility can be a great strength as well as a great weakness. It was very dominant during the “Big 3” era of BI tools in the 2010s but I think that era is receding, especially in the current AI craze. They will still be around but there are simply more choices now than 10 years ago.

But Tableau won’t just disappear of course. Proclaiming “X is dead” has a very poor track record in this field9. I think Tableau “classic” sticks around for teams and companies that need truly advanced, custom visualizations and Server serves on-prem databases well. And of course, there are cases where things are just built out so much in Tableau that it would be too enormous of an effort to switch because it wouldn’t be worth it. The passionate community around Tableau will still be around and experimenting with what changes Salesforce will add to the product as there’s still so much knowledge built around it. Still, it’s being squeezed in a few different ways:
(1) Power BI taking up a lot of market share because many enterprise companies are Microsoft-shops and Microsoft can keep the cost of licenses low due to bundling
(2) Salesforce working on Tableau Next which will they will push to take over Tableau classic (but while Microsoft-shops exist, it’s hard to say as many “Salesforce-shops” do)
(3) Newer BI tools become more popular and appealing. Especially AI-native ones or BI-as-code tools which are poised to take advantage of LLMs’ specialization in text
Tableau has been such a benefit during my career that I don’t even have enough words to describe it in one essay. It was one of the reasons I was able to move on when my career was stuck and its community support has been invaluable. The future is looking to be a lot more varied than the Big 3 era. I wonder what’s in store for us?
Makeover Monday is a weekly data viz challenge that was held by Andy Kriebel and Eva Murray when I was doing it. Eva is actually my current career coach as a matter of fact.
Shoutout to Cole Nussbaumer Knaflic’s “Storytelling with Data”.
I would argue that with Power BI being a Microsoft tool, there’s a bit of OS preferences going on too. There is always going to be a Mac vs PC, iPhone vs Android, Snowflake vs Databricks struggle when it comes to tech tools.
To be fair, there are people who try to master multiple BI tools. Usually consultants who have do that to get as big of a client base as possible. But spending time on multiple tools means you can’t dive as deep into one of them since time is finite. You pretty much have to choose between mastering one tool really well or being more surface level on multiple tools.
This is also what makes it great at creativity though. Because you don’t want things decided for you and you want as little guardrails as possible to experiment and express yourself.
KPI cards for example can be done with a little effort in Tableau. But they are built into newer tools like Sigma by default so you don’t need to repeat manual tasks so much.
GitLab actually has a great workflow for Tableau though. They clearly put lots of deliberate thought into it.
Is this my iPhone 4 moment? You’re holding it wrong! Also, Tableau’s own webpage calls itself a “visual analytics platform”, not a “dashboard platform”.
I wouldn’t mind X.com dying though.